Lock it in Chris, should see 2000ML increases for the next month, not including the extra rain that is coming.
One more event similar to this will cause absolute mayhem.

Welcome New Members! We want to hear from you. Register, stop lurking and start posting!
Melbourne dams
-
Anthony Violi

- Supercell
- Reactions:
- Posts: 2652
- Joined: Mon Nov 23, 2009 9:03 pm
- Location: Lilydale
- Contact:
Re: Melbourne dams
http://www.therealworldweatherforum.com" onclick="window.open(this.href);return false;
avweatherforecasts.com
avweatherforecasts.com
- stevco123
- Supercell
- Reactions:
- Posts: 2936
- Joined: Sat Aug 07, 2010 7:42 pm
- Location: Cranbourne 78m asl
Re: Melbourne dams
I had to change my shower head last week because the old one broke (unfortunately). I installed the new one and couldnt believe the water was only trickling out. I knew straight away what it was but returned to bunnings anyway for their version:
"These days they make shower heads based on customers' needs and they found out that people want water saving shower heads because the old ones waste too much."
WHAT??????? saving water for what? People 'want' water saving shower heads??? Where do they get their research from?Whos water are we saving??? It's my water, I pay for it and will use it as I please.
It is absolutely ridiculous. So off I went to ebay and bought one like the one I had.
I just still cant get over the fact that it was supposed to take Yeeeeaaaarrrrrrssssss to fill up our dams, yet in less than one year most have filled up.
https://www.weatherlink.com/bulletin/53 ... 76dd68e8bc: for current weather updated every 2 minutes
- Macedonian
- Supercell
- Reactions:
- Posts: 2330
- Joined: Mon Dec 21, 2009 10:44 pm
- Location: Mount Macedon Vic at 870m above sea level
Re: Melbourne dams
61.5%
Home- "Shepherd's Bush" at Mt Macedon. 870m
Work- "Bolobek" at Macedon. 430m
Work- "Bolobek" at Macedon. 430m
- Riz The Weather Wiz
- Cumulus
- Reactions:
- Posts: 32
- Joined: Tue Feb 09, 2010 8:21 am
- Location: Melbourne's Eastern Suburbs
Re: Melbourne dams
61.8 % 

-
Karl Lijnders

- Tornadic Supercell
- Reactions:
- Posts: 5771
- Joined: Sun Nov 22, 2009 11:17 pm
- Location: Knoxfield, Victoria
Re: Melbourne dams
A little bit of rain did not much to the dams yesterday. Better prospects coming into early in the new week with 10-25mm possible over all catchments.
Signs of a more extensive event leading into September could drop 50-100mm over the region so one to watch there.
Not unusual to see peaks and troughs in the middle of the filling season, should once again go flying through the roof and could be towards 65% come end of September and 70% at the end of spring!
Former Owner - The Australian Weather Forum. Email me anytime - weatherman1000@hotmail.com
- BigBen
- Cumulonimbus
- Reactions:
- Posts: 135
- Joined: Tue Dec 08, 2009 10:16 am
- Location: Glen Huntly (home) Richmond (work)
Re: Melbourne dams
I'm surprised there isn't a guessing comp to pick the peak, before summer sets in and starts draining teh dams again.
-
Karl Lijnders
- Tornadic Supercell
- Reactions:
- Posts: 5771
- Joined: Sun Nov 22, 2009 11:17 pm
- Location: Knoxfield, Victoria
Re: Melbourne dams
Is that a subtle hint I set something up!? 
Former Owner - The Australian Weather Forum. Email me anytime - weatherman1000@hotmail.com
- Macedonian
- Supercell
- Reactions:
- Posts: 2330
- Joined: Mon Dec 21, 2009 10:44 pm
- Location: Mount Macedon Vic at 870m above sea level
Re: Melbourne dams
I am going to say that we will reach 70.2% at some stage before 2012
Home- "Shepherd's Bush" at Mt Macedon. 870m
Work- "Bolobek" at Macedon. 430m
Work- "Bolobek" at Macedon. 430m
- Lily
- Supercell
- Reactions:
- Posts: 4014
- Joined: Wed Nov 25, 2009 10:29 pm
- Location: Rowville/Lysterfield
Re: Melbourne dams
From Herald Sun http://www.heraldsun.com.au/news/govern ... 6127175091" onclick="window.open(this.href);return false;
Government considers reviewing permanent water restrictions as dams reach record highs
Ashley Gardiner From: Herald Sun September 01, 2011 11:27AM 8 comments
THE Government says it will consider easing water restrictions as Melbourne water storages reach their highest level for more than a decade.
After heavy winter rainfall, the dams are now 61.9 per cent full, compared to 40.9 per cent at the same time last year.
Melbourne’s biggest dam, the Thomson, is now 48.3 per cent full, after dropping to a low of 16.2 per cent during the drought.
The increases could have been greater but for August rainfall being 30 per cent below the long-term average, slowing the rate of growth in dam levels.
An easing of water restrictions is now possible, although this will not be reviewed until the end of November.
The State Government will also consider a review of permanent water savings rules.
Water retailers City West Water, South East Water and Yarra Valley water are currently conducting public consultation on the permanent rules.
Water Minister Peter Walsh said Melbourne’s healthy water levels were the result of rainfall and water savings.
In 1998, winter water consumption in Melbourne was 1143 megalitres a day.
This time, it was only 944 megalitres.
“(This demonstrates) that Melburnians have made long-term change in the way they use water,” Mr Walsh said.
- BigBen
- Cumulonimbus
- Reactions:
- Posts: 135
- Joined: Tue Dec 08, 2009 10:16 am
- Location: Glen Huntly (home) Richmond (work)
Re: Melbourne dams
No, but now you've mentioned it ..... I just love a tipping/guessing comp of any kind.Karl Lijnders » Fri Aug 26, 2011 5:10 pm wrote:Karl Lijnders wrote:Is that a subtle hint I set something up!?
-
crikey

- Supercell
- Reactions:
- Posts: 1314
- Joined: Mon Feb 07, 2011 8:02 pm
- Location: tweed shire NSW and nDUNOLLY.. Nth Central district VIC
- Contact:
Re: Melbourne dams
Just catching a glimpse of the Melbourne dam levels on the front page of the AGE yesterday I am sure l read.. same time last year 56% Now ( July 2nd 2012)
70.3%
Is that correct?
I couldn't help thinking..
....IF ..we are coming out of a dry period for Melbourne which was
(approx .. a 34 year period..1976 to 2010) which apparently started changing to ? a not so dry phase ? around late 2009and into La Ninas 2010/2011
and ...talk. of wet indicators like cool PDO , IOD neg, low solar max etc in the future .?
How would the Melbourne dam system cope?
Would we see water releases like Brisbane had in the coming years from our Dams??
The IF's are quite mind boggling really.
Re: Melbourne dams
Nearing 71% now. http://www.melbournewater.com.au/conten ... report.asp" onclick="window.open(this.href);return false;
Go the bombersss!
-
Anthony Violi
- Supercell
- Reactions:
- Posts: 2652
- Joined: Mon Nov 23, 2009 9:03 pm
- Location: Lilydale
- Contact:
Re: Melbourne dams
Exactly what i have said Crikey. All the records we broke in 1974 were at the end of the cold PDO and wet cycle.
Within 6 months our dams could fill and cause all sorts of problems. And with the Cold PDO and La Nina dominated weather for the next 15 years, it raises the question of how bad the flood crisis that is coming will be.
Extraordinary to break rainfall records at the start of the wet cycle. Sets us up for devastating floods.
http://www.therealworldweatherforum.com" onclick="window.open(this.href);return false;
avweatherforecasts.com
avweatherforecasts.com
-
daviescr

- Supercell
- Reactions:
- Posts: 1394
- Joined: Wed Dec 02, 2009 5:40 pm
- Location: Warranwood, Vic
Re: Melbourne dams
I think there's little doubt the dams will fill again (actually think they are a lot fuller than they are reporting!!) but my worry is how will the dam walls cope with being full again? I've read about how dam wall often 'dry out' during extended low periods, and then struggle with the load when they refill.
Anyone have comment on this? If true, I shudder to think of the consequences
Anyone have comment on this? If true, I shudder to think of the consequences
-
mick

- Supercell
- Reactions:
- Posts: 1453
- Joined: Mon Nov 30, 2009 6:45 pm
- Location: Mid North SA Baaaaaaaaaaaaaaa
Re: Melbourne dams
All the lil dams are chockers (scuse technical terms).
Most of the lil ones are now being released as "environmental flows". I forget the details, not at work but I will get them for you.
There are always rumours re dam walls. Its not the walls that are a worry, its the valves and fittings and pipes and gates. About once a week there is a major component failure on a dam, they not reported, just normal really.
-
crikey
- Supercell
- Reactions:
- Posts: 1314
- Joined: Mon Feb 07, 2011 8:02 pm
- Location: tweed shire NSW and nDUNOLLY.. Nth Central district VIC
- Contact:
Re: Melbourne dams
Driving past cairn curran today near Maryborough and is full to brim
The streams in castlemaine flowing and so is loddon at newstead and deep creek at carisbrook
and that is with only 30mm of rain
and
this area has just had a 'droughtish' autumn ( 3 months) and yet in one decent rain all is forgotten
brown to green in one week
The streams in castlemaine flowing and so is loddon at newstead and deep creek at carisbrook
and that is with only 30mm of rain
and
this area has just had a 'droughtish' autumn ( 3 months) and yet in one decent rain all is forgotten
brown to green in one week
-
crikey
- Supercell
- Reactions:
- Posts: 1314
- Joined: Mon Feb 07, 2011 8:02 pm
- Location: tweed shire NSW and nDUNOLLY.. Nth Central district VIC
- Contact:
Re: Melbourne dams
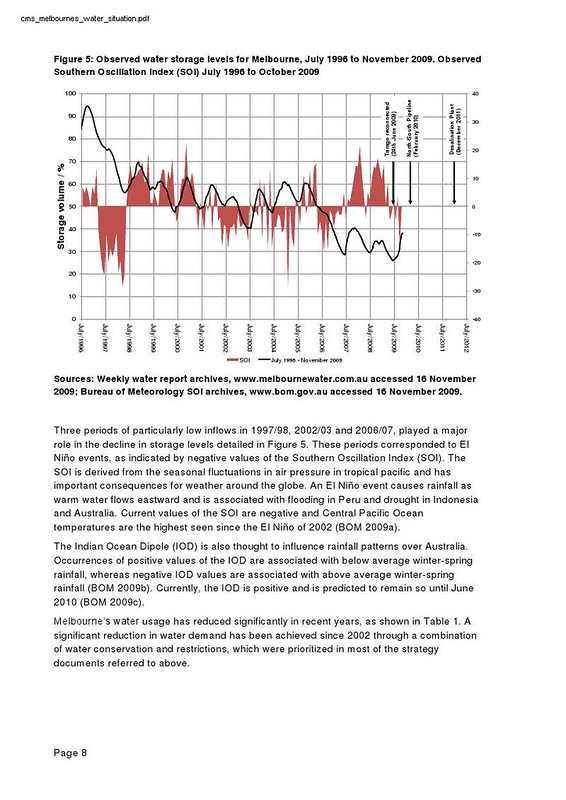
I came across this nice graph of melbourne water storages graphed against the SOI
( southern oscillation index )
Firstly
Our Melbourne water storage levels are strongly correlated with the fluctuations of the SOI and impending El Nino/La nina oscillations
I was amazed to see how a strong el nino can take out our water storages very quickly
Note our melbourne water storage dropped a massive 40% !!
from 1996 to the end of 1997 during an El Nino
ranked as strong El Nino by SOI index but was only ranked as a weak to moderate el nino ?
Interesting our storages returned just as quickly with a strong La nina of 2010/11
Also of note is the comment re the Indian ocean dipole which was positive during most of this low rainfall decade l assume
would be good to see a dam level graph superimposed over the IOD index as well
This report was developed during the end of that dry period at a time when the authorities must of been panicking with supplies down under 30% in 2009
Notice the desalination plant was due to be on line around Jan 2012
The graph shows a steady decline of water supply and a catastrophic situation if rainfall did not return.
The full article is an interesting read
as the authorities prepared for dams to empty
This is the cached version from google instead of the pdf
https://docs.google.com/viewer?a=v&q=ca ... low84u3Sig" onclick="window.open(this.href);return false;
Re: Melbourne dams
http://www.melbournewater.com.au/conten ... orages.asp" onclick="window.open(this.href);return false;
Strongest Winter inflows for the Melbourne catchment since 1990
Strongest Winter inflows for the Melbourne catchment since 1990